

2025.11.28 Олон улсын олимпиадын сунгаа 6
November 28, 20252025.12.26 Олон улсын олимпиадын сунгаа 8
December 26, 2025Mongolia’s Export Restructuring and Inclusive Growth (10 points)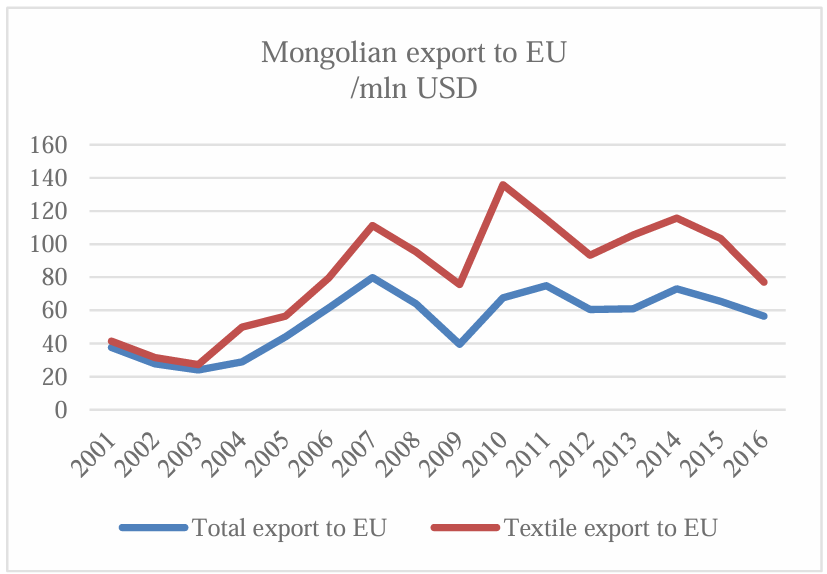
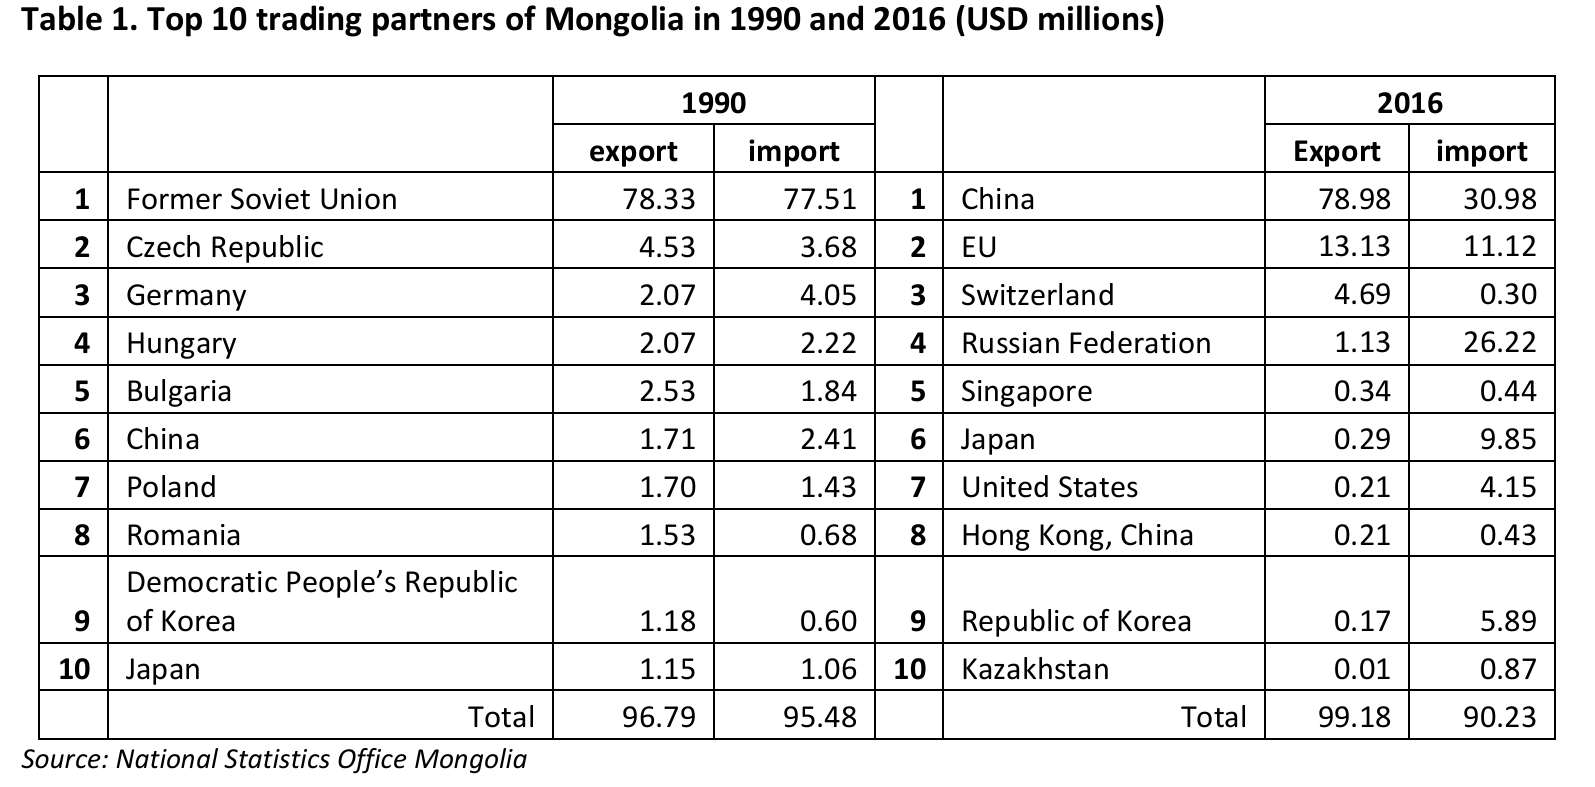
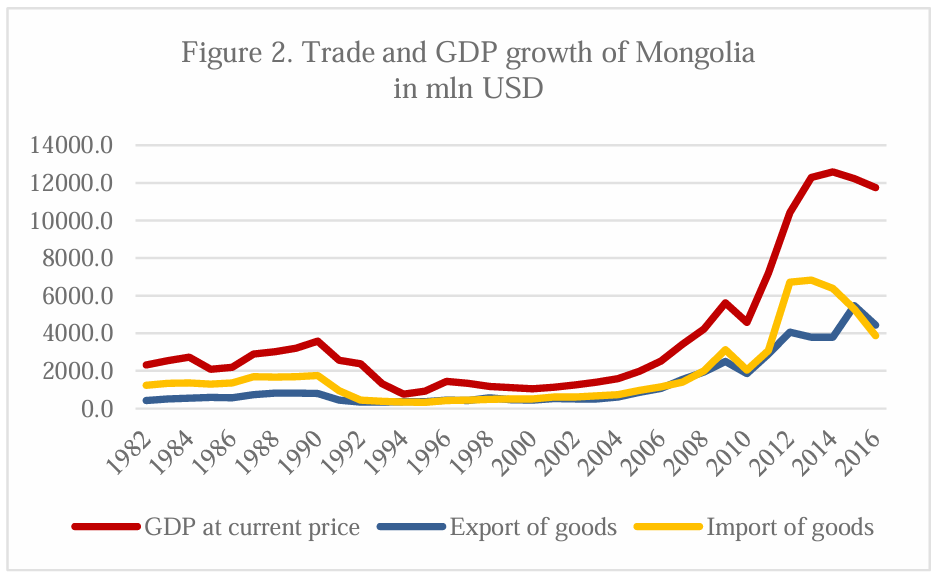
Using Figures and Tables, evaluate how Mongolia’s export structure has changed from 1990 to 2016 and how these changes have affected economic complexity, employment, and poverty. Your answer must address all of the following:
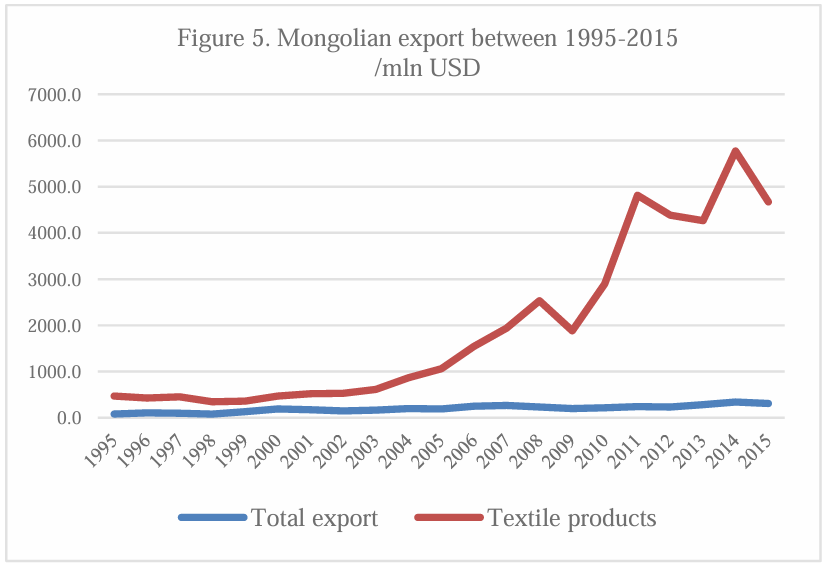
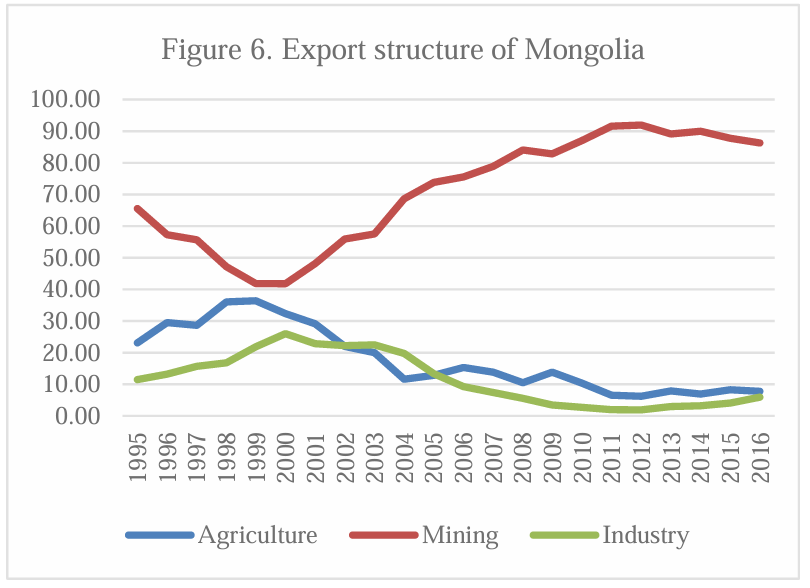
1. Structural Change in Exports (3 points)
Using the export structure graph and total export graphs:
A. Identify two major structural shifts in Mongolia’s export composition between 1995–2016.
B. Use specific evidence from the figures.
C. Explain how the rise of mining and the stagnation of manufacturing affected Mongolia’s economic complexity.
2. Textile Sector vs Mining Sector (3 points)
Using the EU export graph and the “Summary of Trade Preferences” reading:
A. Describe how textile exports behaved compared to total exports to the EU.
B. Explain why the textile sector plays a disproportionately large employment role compared to mining, despite its small share in total exports.
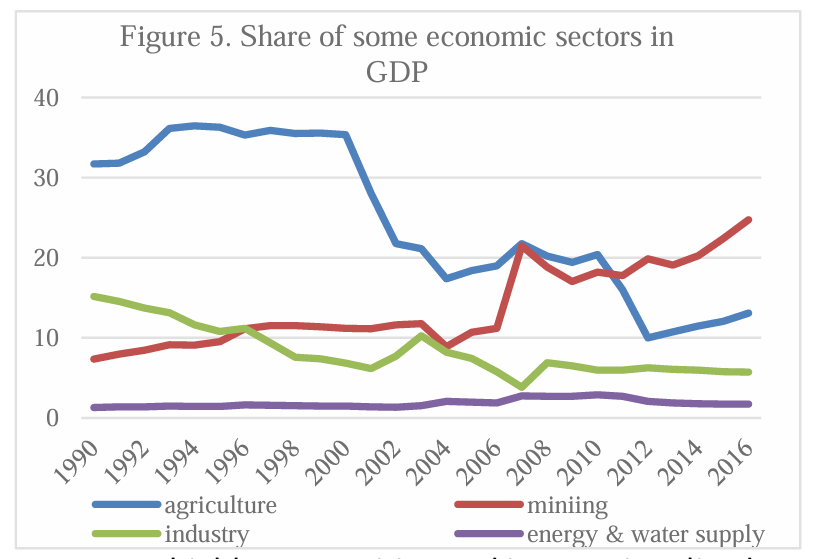
3. Linking Trade Patterns to Poverty & Unemployment (2 points)
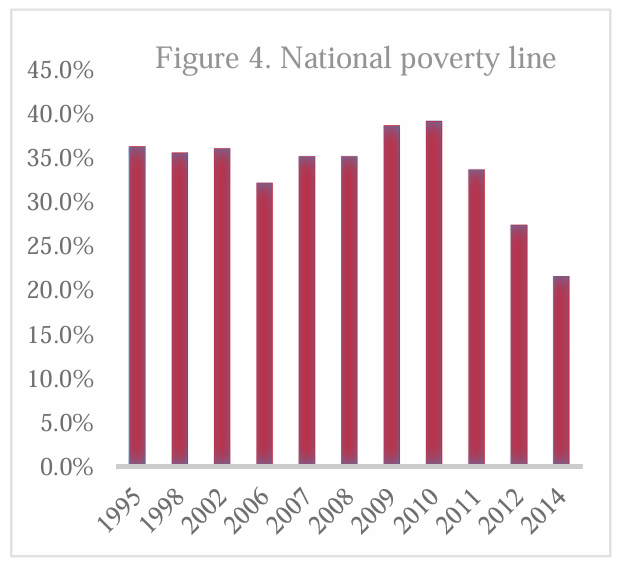
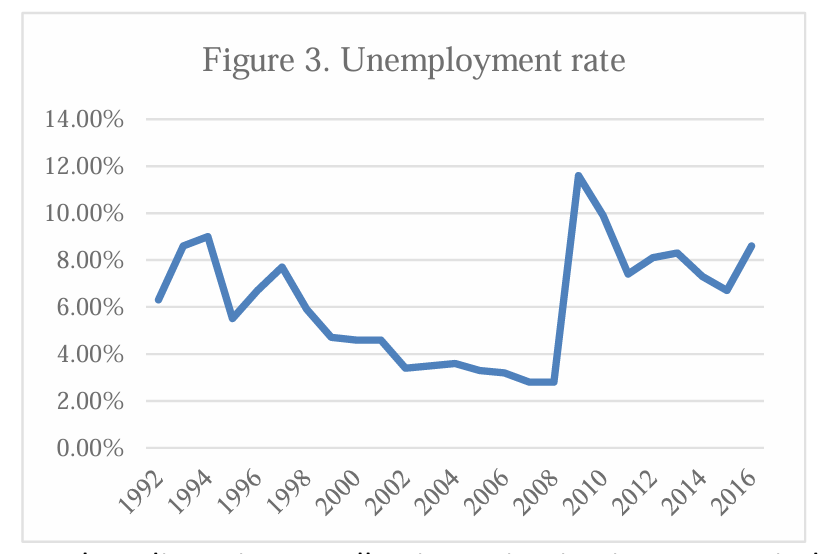
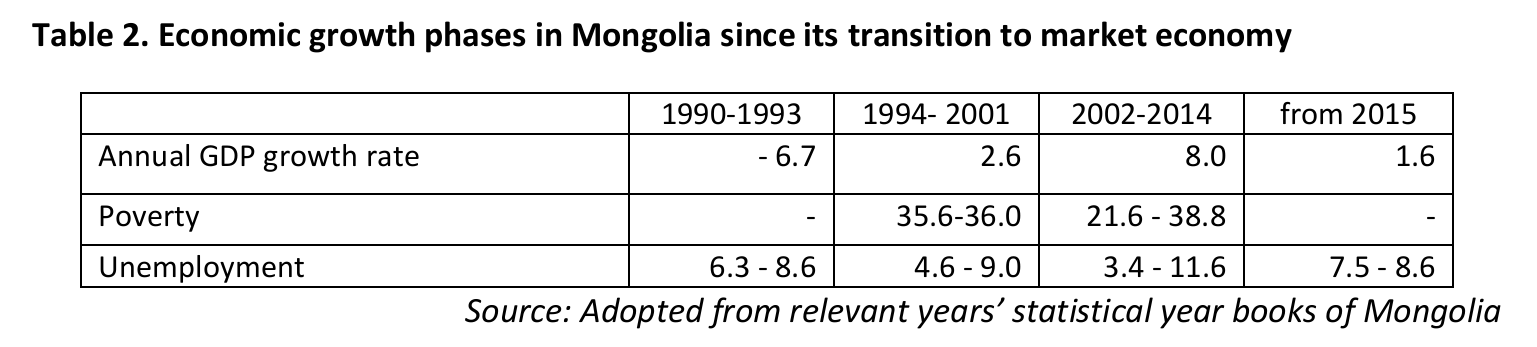
Using the poverty rate chart, unemployment chart, and Table 2:
A. Identify one period where mining growth did not reduce poverty and explain using GDP vs sector share graphs.
B. Evaluate whether Mongolia’s transition to capital-intensive exports helped or harmed inclusive growth.
4. Policy Evaluation (2 points)
Based on the data and text:
A. Assess whether Mongolia’s current export structure is sustainable.
B. Recommend two policy actions that would strengthen labor-intensive manufacturing while maintaining export revenue.